
How to Look Up Greenville County Jail Population Data
The county does not run a live jail population dashboard on the pages reviewed. What it does publish is facility and capacity detail. The screenshot below shows the Adult Facility page, which describes the buildings and the rated capacity that frame any population figure.
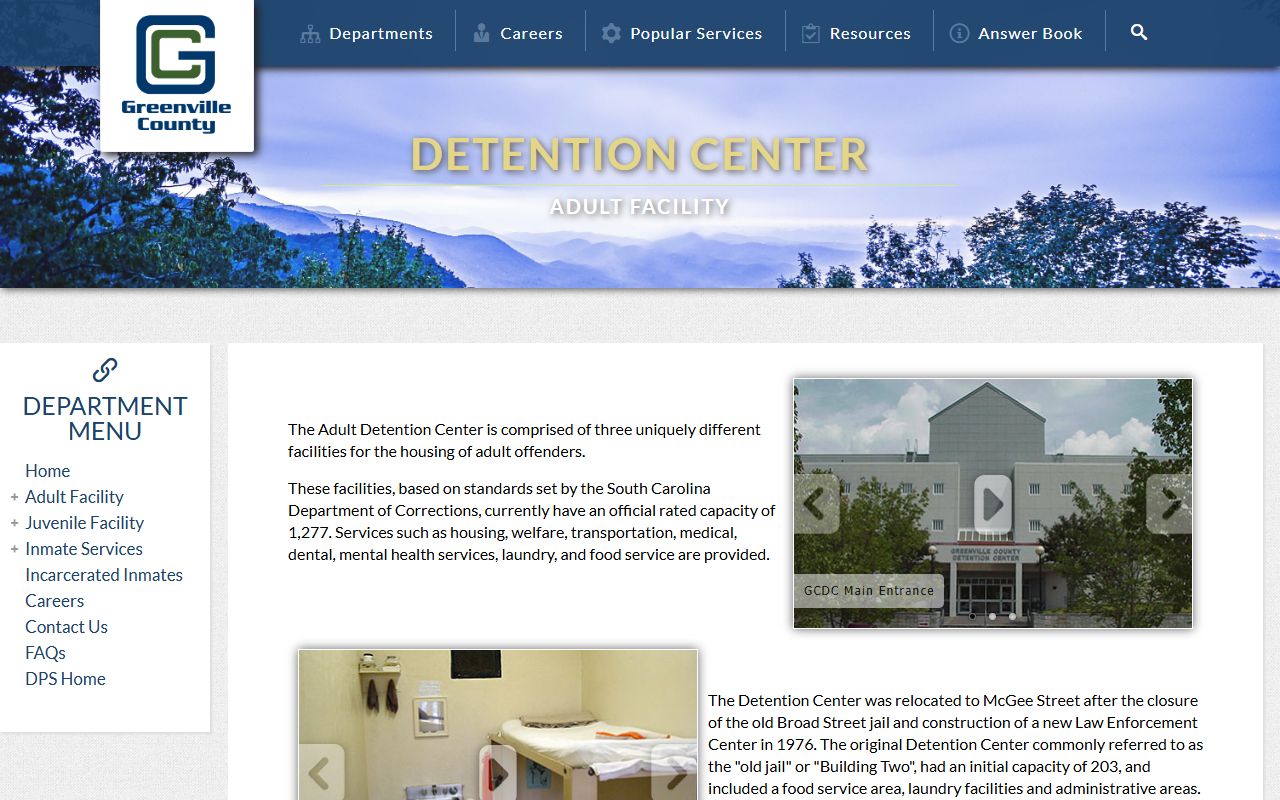
The county adult facility page lists the three housing buildings and their functions. For the actual daily count, you contact the Detention Center, because no public page reviewed posts a running total. For broad trends over time, national research tools fill the gap. The Detention Center homepage is the central hub for operations detail.
Read these figures carefully. The rated capacity is an official, fixed number. Any current-population figure is not published by the county and should be confirmed by phone or pulled from a county budget or performance report, not estimated.
Greenville County Jail Capacity Overview
The Adult Detention Center has a total rated capacity of 1,277 across three adult housing buildings on the McGee Street complex. Building Two is the oldest, with 511 beds, and now serves mostly as housing after renovations. Building One holds 318 and runs intake, release, food service, medical care, and housing for medical and mental-health needs. Building Four, built in 2007, adds 448 beds. The table below lays out the official capacity by building.
| Building | Rated Capacity | Current Population |
|---|---|---|
| Building One | 318 | Not publicly published |
| Building Two | 511 | Not publicly published |
| Building Four | 448 | Not publicly published |
| Total Adult Facility | 1,277 | Confirm with Detention Center |
The 1,277 figure is the rated capacity, not the daily population. The current-population column is marked unpublished on purpose, since the county pages reviewed do not post a live count. The Detention Center homepage is the source for the building and capacity detail.
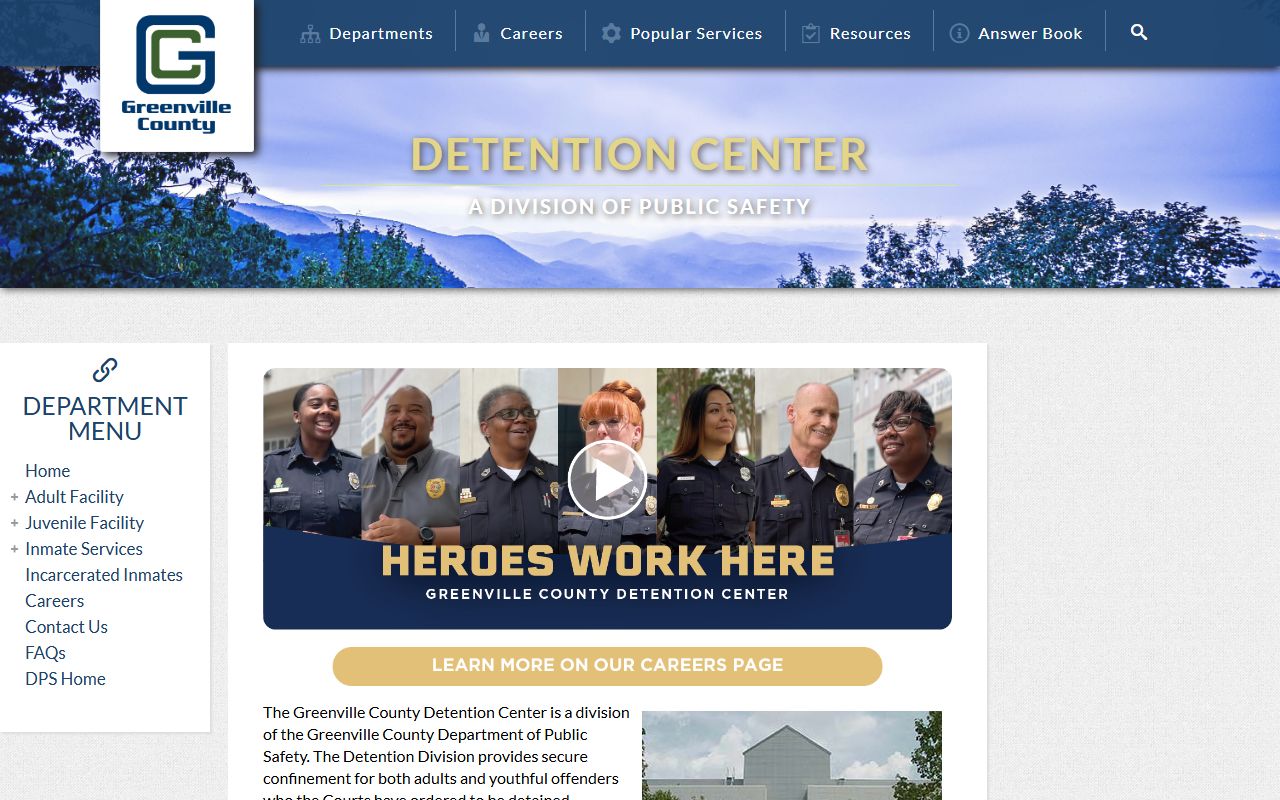
The image above shows the Detention Center homepage, the entry point for facility and capacity information.
The buildings carry a long history. Building Two is the old jail. It moved to the McGee Street site after the old Broad Street jail closed and the county built a new Law Enforcement Center in 1976, and it first held about 203 people. Building One went up next door in 1994 with an initial capacity near 288. Building Four came last, in 2007, and added 448 beds. Each round of building raised the total to the 1,277 figure used today.
What Capacity Means and Does Not Mean
Capacity and population are two different things, and the gap matters. Rated capacity is the official number of beds or places approved under standards. Population is the live count of people held on a given day. A jail can sit below, at, or above its rated capacity, and the number shifts daily as people are booked, bonded out, sentenced, or moved. So the 1,277 figure tells you the size of the Greenville County facility, not how full it is right now.
Transfers add another layer. People leave the county jail in many ways. They bond out, get released on a court order, move to state prison, go to federal custody, transfer to another county, or head to a hospital. Each move changes the headcount without changing the rated capacity. That is why a current population number has to be confirmed directly and cannot be read off the capacity total.
Average Daily Population
Average daily population, often shortened to ADP, is the mean number of people held across a period such as a year. It is not the same as bookings. A person booked and released the same day adds to admissions but barely moves the ADP. The county pages reviewed do not publish an ADP figure or a five-year daily-population dashboard.
Because of that, an honest ADP number for Greenville County has to come from a county budget or performance report, or be confirmed with the Sheriff's Office. National groups can supply historical context, but they should not stand in for a current local count. Capacity is officially 1,277; the current population should be confirmed with the Detention Center.
Demographic Breakdown
A demographic breakdown would split the population by sex, race, and age. The county pages reviewed do not publish those splits for the Greenville County jail population. So the honest read is that this data was not located in official county sources, and no figures are invented to fill it.
| Group | Percent of Population |
|---|---|
| Sex breakdown | Not published by the county |
| Race breakdown | Not published by the county |
| Age breakdown | Not published by the county |
For demographic context at the county and state level, the Vera Institute and the Bureau of Justice Statistics offer historical data drawn from national jail surveys. That context is broad, not a current Greenville County snapshot.
Pretrial vs. Sentenced Population
The county inmate-search disclaimer says most people held at the jail are pretrial detainees. That means they have been charged but not convicted, and many are waiting on a court date or a bond decision. It is a meaningful statement about who fills a county jail. The county does not, though, publish an exact percentage in the pages reviewed.
| Status | Share |
|---|---|
| Pretrial | Most inmates, per county disclaimer; no exact percent published |
| Sentenced | Remainder; no exact percent published |
This pretrial reality is why a roster hit is not a sign of guilt. People listed on the inmate records roster are largely awaiting resolution of a case, not serving time.
Misdemeanor vs. Felony Population
A misdemeanor and felony split would show how many people are held on lesser charges versus serious ones. The county does not publish this breakdown for the jail population in the pages reviewed. Transfers also blur the picture, since people move between the county jail, state prison, federal custody, other counties, a hospital, and release.
Court delays and bond practices can shape how long people stay and which charges dominate the daily count. No Greenville County dashboard was located that breaks the population down by charge level, so any such split would need a county budget or performance report to back it.
Mental Health and Medical Population
Building One was designed with housing for people with medical and mental-health needs. Health Services runs inside both the Adult Detention Center and the separate Juvenile Detention Facility, staffed around the clock. The team includes physicians, a forensic psychiatrist, a physician assistant, a family nurse practitioner, supervisors, nurses, critical care technicians, medical assistants, and mental health counselors. The screenshot below shows the jail medical page.
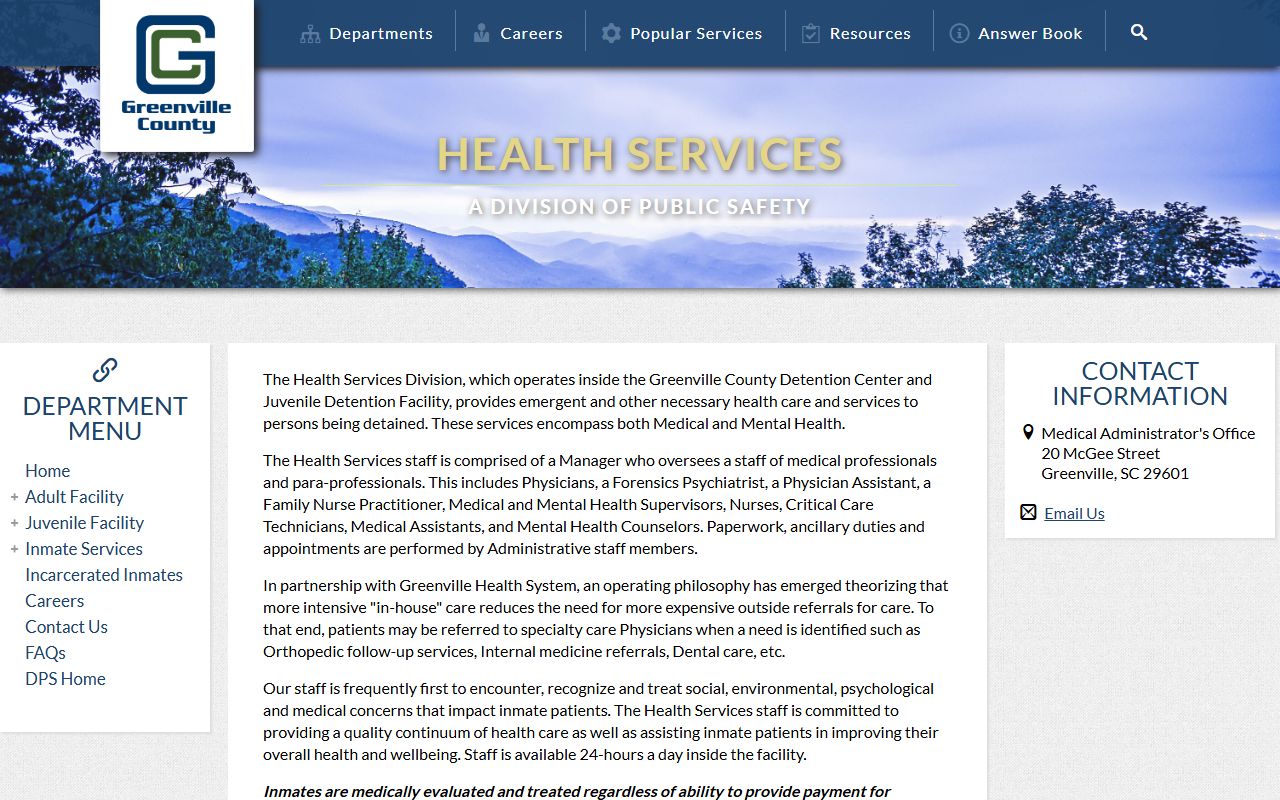
The county jail medical page describes 24-hour health coverage. Medical care is given regardless of ability to pay, though a $5 co-payment may apply per occurrence. The county does not publish a count or percentage of the population receiving mental-health or medical care.
National and State Context
Since the county posts no live count, national research supplies the trend backdrop. The Vera Institute tracks incarceration trends using jail data, average daily jail population, and county population denominators. The Bureau of Justice Statistics separates jail custody from prison custody and reports national and state trends each year. The screenshot below shows the Vera South Carolina page.
The Vera South Carolina trends page gives state-level context, not a current Greenville County figure. The table below frames how a county, state, and national rate would compare. It is marked as context only, because the county does not publish its own per-100,000 rate.
| Level | Jail Population per 100k |
|---|---|
| Greenville County | Not published; confirm with county sources |
| South Carolina | See Vera and BJS for state context |
| National | See BJS annual jail reports for context |
Note: These context figures come from national research methodology and are not a current Greenville County jail count, which must be confirmed directly.
Population Trends Over Time
The county's current jail pages publish capacity and operations detail but not a five-year daily-population dashboard in the pages reviewed. For trends, the Vera Incarceration Trends tool is the main resource, since it compiles county-level jail data over years. The screenshot below shows that tool.
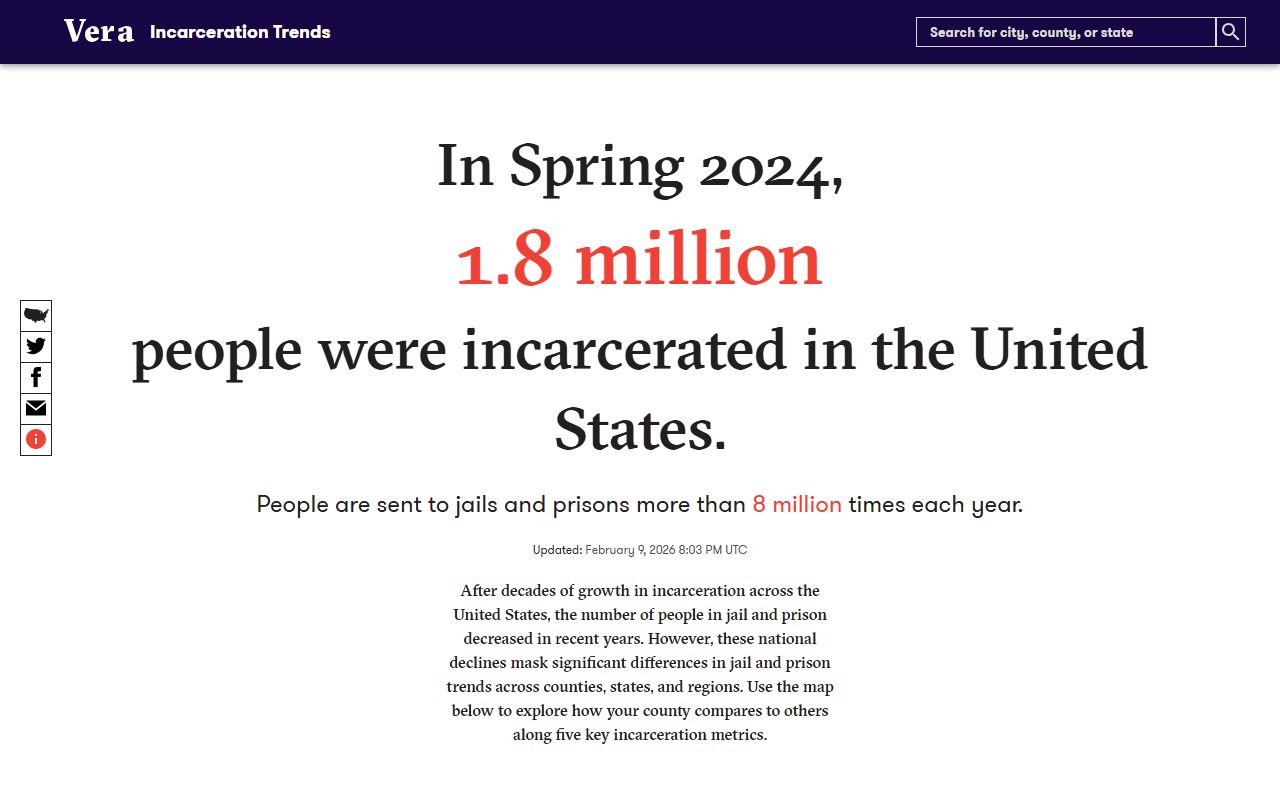
The Vera Incarceration Trends tool lets you view county-level jail data drawn from national surveys. For a true multi-year Greenville County trend, the county budget or performance reports would need to be pulled separately, since the figures were not located in the facility pages reviewed.
Searching Greenville County Inmates by Name
This page covers aggregate jail population data, not individual lookups. For a name-based search of the live jail roster, use the Greenville County inmate records page, which explains the county search portal, booking, and bond detail.
Where the Data Comes From
The capacity and facility figures come straight from the county Detention Center pages. The 1,277 total and the per-building counts are official county numbers. The population context, by contrast, leans on national research because the county does not post a live count. The denominator for any per-capita rate is the county's resident population.
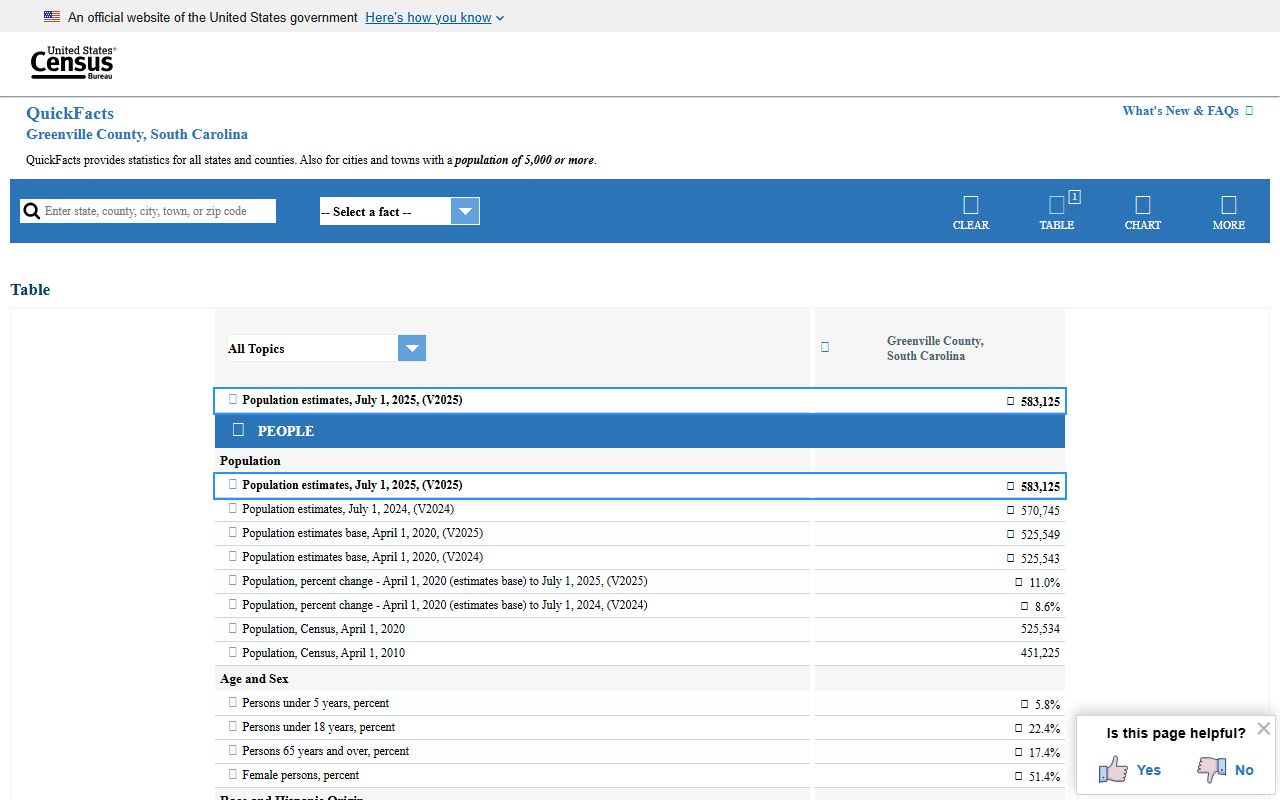
The Census QuickFacts page supplies the county population denominator used in any rate calculation. Capacity data comes from the county; trend and rate context comes from Vera and BJS; the population base comes from the Census. Each source has a clear role, and none should be mixed up with a current daily jail count.